What is Chemometrics? A brief story
How chemometrics was born: the story of how chemists met multivariate data, and the ideas and people that shaped the discipline.
In the analytical laboratories of the 1970s, remarkable changes were taking place. Instruments became more sensitive and computers grew more powerful, creating huge amounts of data that were unimaginable just decades earlier. For example, a single infrared spectrum could contain thousands of data points, and a mass spectrometer might produce detailed fragmentation patterns showing how a molecule breaks apart. Nuclear magnetic resonance experiments yielded multidimensional datasets full of variables that scientists could not easily interpret.
Despite this richness, chemists faced a fundamental mismatch. Traditional analytical chemistry was built on selectivity: you design an experiment to measure one thing at a time, eliminating interferences and isolating the signal you're interested in. But modern instruments were inherently multivariate. When you run an infrared spectrum, you don't get a single measurement; you get thousands of measurements at different wavelengths, each influenced by multiple chemical components in complex, overlapping ways. A chemist could try to maintain the traditional one-at-a-time approach by manually identifying and interpreting characteristic absorption bands individually (a carbonyl stretch here, an O-H stretch there). But with thousands of variables in a single spectrum, this becomes tedious and you inevitably miss subtle correlations between different spectral regions. The problem escalates dramatically when analyzing many samples. Now you're not just dealing with thousands of variables, but trying to find systematic patterns across dozens or hundreds of spectra, understanding how multiple bands change together across samples, and identifying which spectral differences actually matter for distinguishing samples. The multivariate nature of the problem demanded a multivariate solution.
This gap was being felt simultaneously by researchers around the world, though initially they didn't know others were grappling with the same challenges. In January 1971, Swedish professor Svante Wold at Umeå University applied for a grant from the Swedish Science Council to address exactly these problems [1]. As an organic chemist who was already exploring statistical approaches to chemical problems, building on his father Herman Wold's pioneering work in statistics, he needed better computational tools to handle datasets with dozens or even hundreds of variables. Examining one variable at a time left many patterns unseen. Building on this statistical foundation, he formalized his vision by coining a new term in his proposal: chemometrics (Swedish: kemometri) [2].
Meanwhile, across the Atlantic, Bruce Kowalski at the University of Washington was independently developing solutions to the same fundamental problem. Kowalski, trained in analytical chemistry, had become fascinated by the potential of computers to help chemists extract more information from their experiments. As he would later recall:
People like myself, Svante and others were just sort of tired of seeing all those numbers floating around and started scratching our heads and saying: there must be some way to pull information out of all these numbers [3].
At the same time, a third independent stream was emerging in Europe. In 1972, Luc Massart attended a EUROANALYSIS meeting in Heidelberg, where his work on formal methods in analytical chemistry caught the attention of Auke Dijkstra. This chance encounter sparked a collaboration focused on information theory and clustering methods for determining information content in analytical measurements [4].
Notably, Massart's entry into the field occurred before he had even heard the term "chemometrics." The word was later introduced to him through an invitation from Wold and Kowalski to join the Chemometrics Society in 1974, after they discovered his work with Kaufmann published in Analytical Chemistry [3].
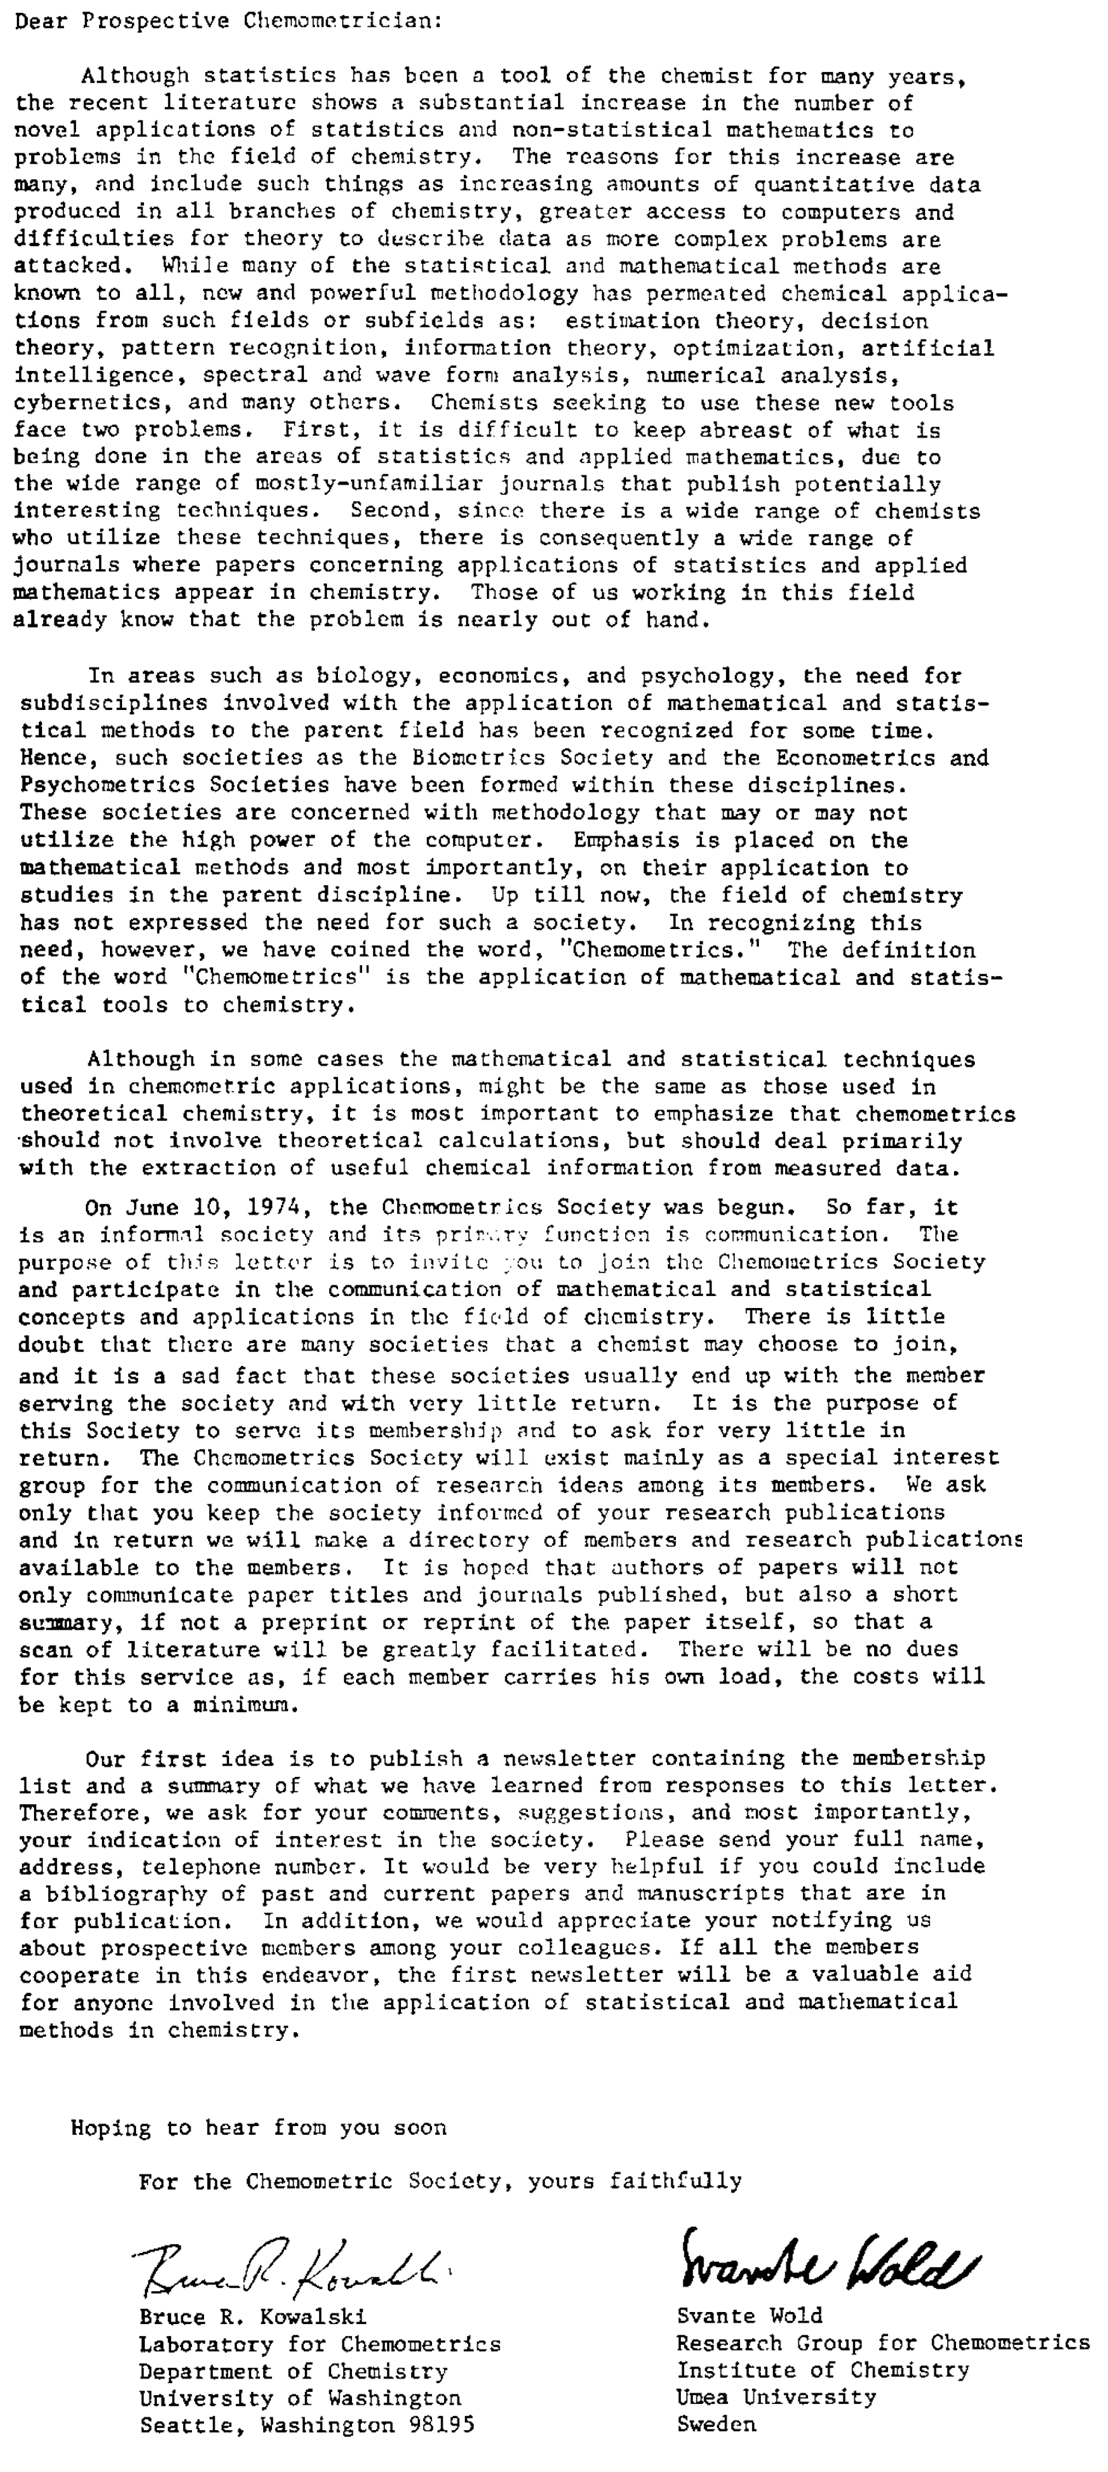
This pivotal moment in chemometrics history is preserved in the original invitation letter from 1974, sent by Wold and Kowalski to the founding members. This document captures the collaborative spirit and scientific vision that launched the International Chemometrics Society.
The original 1974 invitation letter that launched the International Chemometrics Society
The word itself was elegant in its simplicity: Chemometrics, from chemistry and metrics, captured the essence of what was needed, i.e., the quantitative analysis of chemical data using mathematical and statistical methods. Wold's first publication using this new term appeared in 1972 in the Swedish journal Kemisk Tidskrift (volume 84, pages 34–37) in his paper "Spline-funktioner – ett nytt verktyg i dataanalysen" (Spline functions – a new tool in data analysis), where he formally named his research unit the "Forskningsgruppen för Kemometri (Research Group for Chemometrics), though it would take several years for the concept to gain broader recognition.
The roots of the International Chemometrics Society go back to June 10, 1974 in Seattle, when Wold travelled to Kowalski's group. On that trip, Wold and Kowalski compared SIMCA and ARTHUR on standard data sets, then celebrated with their teams at a bar and grill on the UW strip; in Wold's words, the society was formed "after ten shots of tequila", giving formal recognition to what would become one of chemistry's most important interdisciplinary fields [5]. Later, it was renamed to International Chemometrics Society (ICS) [1],[5].
One year later, in 1975, Bruce Kowalski published the first English-language paper with "chemometrics" in its title: "Chemometrics: Views and Propositions" in the Journal of Chemical Information and Computer Sciences (volume 15, issue 4, pages 201–203). This short but seminal paper served as a manifesto for chemometrics as a distinct discipline [3].
The Evolution of Chemometrics
How chemistry learned to embrace data
Statistical foundations (PCA & t-test)
Pearson’s PCA (1901) and Gosset’s t-test (1908) lay the groundwork for chemometrics.
Statistical methods mature
Youden and Box develop experimental design methods applicable to chemical problems.
Methods enter chemistry
Statistical methods begin entering mainstream analytical chemistry through pioneers like Malinowski.
Birth of 'Chemometrics'
Svante Wold coins 'chemometrics' in a grant application at Umeå University.
Scientific debut
Wold's first paper using the term 'chemometrics' appears in Kemisk Tidskrift.
Institutional birth
International Chemometrics Society established by Wold and Kowalski.
Academic legitimacy
Key textbooks published by Malinowski, Sharaf et al., and Martens & Naes.
Global community
Major international gathering of chemometricians in Cosenza, Italy.
Publishing infrastructure
Chemometrics and Intelligent Laboratory Systems (1986) and Journal of Chemometrics (1987).
With the formal establishment of chemometrics as a distinct discipline, researchers began developing the mathematical toolkit that would define the field. This is where chemometrics represented a fundamental paradigm shift: rather than eliminating complexity to achieve clarity, it embraced complexity as a source of information. Methods that could handle all the variables simultaneously found patterns and relationships that would be invisible to traditional one-at-a-time analysis [6],[7],[11].
Principal Component Analysis, originally developed by Karl Pearson in 1901 [8] and further refined by Harold Hotelling in 1933 for psychological and social science applications [9], was adapted for analytical chemistry data and became one of chemometrics' foundational tools [10]. PCA could take a dataset with hundreds of variables and find the underlying "directions" in the data that contained the most information, thereby reducing the complexity while preserving what mattered most.
In fact, long before its formal adoption in chemometrics, PCA-like thinking had already appeared in organic chemistry. Wold noted that physical organic chemists had long used "PC-like" one- or two-component linear free-energy relationships (LFERs) (e.g., the Brönsted and Hammett equations) to understand reactivity patterns among similar molecules [1].
But PCA was just the beginning. Herman Wold, Svante's father and a distinguished statistician, introduced the NIPALS algorithm in 1966 [12] and, in the 1970s, developed Partial Least Squares (PLS) for econometric/path modeling [13]. Svante Wold and colleagues adapted and extended PLS for chemical calibration and prediction in the late 1970s and early 1980s [14],[15],[16]. PLS relates complex, high-dimensional instrumental measurements to the properties that matter (e.g., predicting an analyte's concentration from spectroscopic data). This wasn't just mathematical elegance; it was practical problem-solving that changed how chemists worked.
The early days of chemometrics were marked by a sense of discovery and possibility. Researchers were finding that techniques originally developed for psychology, economics, or social sciences could be adapted to solve chemical problems. Factor analysis, cluster analysis, and pattern recognition methods all found new life in chemical applications. The field was inherently interdisciplinary, drawing from wherever the best tools could be found. Methods like multivariate curve resolution, developed by researchers such as Lawton and Sylvestre in the early 1970s, showed how mathematical techniques could "unmix" complex spectra to identify individual components. Software development was crucial: Bruce Kowalski's ARTHUR system became the first major chemometrics software package. It provided modules for scaling (SCALE), principal component analysis (KAPRIN, KATRAN), and visualization (VARVAR).
The 1980s brought a wave of foundational publications that would shape the field for decades. Edmund Malinowski's "Factor Analysis in Chemistry" (1980, with a second edition in 1991) provided a rigorous mathematical foundation for understanding how multivariate methods worked with chemical data [17]. The textbook by Sharaf, Illman, and Kowalski "Chemometrics" (1986) established chemometrics as a legitimate field of study, complete with its own theoretical framework and practical methodologies [18]. Martens and Naes wrote an influential guide "Multivariate Calibration" (1989), showing how these mathematical concepts could be applied to solve real analytical problems [19].
During this period, the field also began to develop its institutional identity. The journal Chemometrics and Intelligent Laboratory Systems was founded in 1986, followed by the Journal of Chemometrics in 1987, providing dedicated venues for chemometric research [20]. Software packages like SIMCA and The Unscrambler made chemometric methods accessible to practicing chemists who weren't mathematical specialists [21]. The first major international conference was the NATO Advanced Study Institute on Chemometrics: Mathematics and Statistics in Chemistry, held in Cosenza, Italy from September 12–23, 1983, organized by Kowalski and Massart, bringing together virtually all the founding figures of chemometrics for the first time [22].
As computers became more powerful and easy to use in the 1990s, chemometrics began to move out of the analytical chemistry lab. Early methods for real-time process control using multivariate models appeared in the 1980s and 1990s. The FDA introduced Process Analytical Technology (PAT) in a draft guidance (September 2003), with final guidance issued in October 2004. This framework showed manufacturers how to predict product quality from online measurements and adjust processes quickly when something went wrong.
The biological sciences became another key area for chemometrics. In the early 2000s, these fields grew rapidly because new instruments could measure thousands of molecules at once. Researchers had to work with very large datasets. Traditional statistics, which handle only dozens or hundreds of variables, were not enough and chemometric methods helped scientists make sense of these large biological datasets.
Environmental monitoring also benefited from chemometrics. Since the 1990s, air quality stations have collected continuous data from many sensors. Water quality networks face the same challenges, with many measurements over time and space. In these applications, chemometric tools, like principal component analysis and cluster analysis, help to find real environmental trends in these complex data.
The relationship between chemometrics and machine learning has been particularly interesting to watch develop. In many ways, chemometrics anticipated the challenges that would later drive the development of modern machine learning. The high-dimensional, noisy datasets that are routine in chemistry share many characteristics with the big data problems that sparked the machine learning revolution.
However, machine learning has complemented rather than replaced traditional chemometric methods. A strong reason is that classical chemometric methods naturally align with the mathematical structure of chemical data: bilinearity in spectroscopic measurements, non-negativity constraints in concentrations and spectra, and low-rank approximations that reflect the underlying components in mixtures. These methods were designed around the inherent nature of chemistry, incorporating physical constraints and mechanistic knowledge from thermodynamics, quantum mechanics, and reaction kinetics. This alignment delivers both predictive power and scientific interpretability in ways that purely data-driven approaches often cannot match.
Therefore, classical chemometric methods often offer something that many machine learning approaches can lack: transparent interpretability. For example, a PCA model may show that most of the variation in a dataset is captured by a small number of principal components; by examining the scores and loadings a chemist can sometimes connect these components to underlying chemical or physical sources of variation. Likewise, when a PLS model predicts analyte concentration from spectroscopic data, the regression coefficients can be inspected to identify which wavelength regions contribute most to the prediction. This interpretability remains crucial in scientific applications, where understanding why a model works is often as important as how well it performs.
Nowadays, modern chemometrics represents a mature field with a rich theoretical foundation and proven practical applications. Software packages like R, Python's scikit-learn, and specialized chemometric software have made sophisticated analyses accessible to researchers who aren't mathematical specialists.
Yet the field continues to evolve. Multi-way methods handle datasets with multiple modes or dimensions, like time-resolved spectroscopy data or multi-sensor monitoring systems. Uncertainty quantification has become increasingly important as chemometric models are used for regulatory decisions and quality control applications where understanding prediction reliability is crucial. Real-time applications require algorithms that can process streaming data and update models on the fly.
Looking toward the future, several trends seem likely to shape the continued evolution of chemometrics. The relationship with artificial intelligence will probably deepen, but in ways that preserve the domain knowledge and interpretability that characterize traditional chemometrics. The most promising developments seem to involve hybrid approaches that leverage the strengths of both paradigms.
Recently, large language models have started to play a role in chemometrics. These models help people understand and use chemometric methods more easily. A student can ask, "What preprocessing should I use for this NIR dataset?" and get a simple explanation, examples, and even code. This makes learning faster and easier.
LLMs may also change how we work with instruments. Instead of using complicated menus, scientists could type or say, "Find the best method to measure caffeine using UV-Visible." The system could then suggest a method, explain why it works, and adjust settings on its own.
In the future, we may have smart instruments that can communicate with us. An instrument might alert you: "I found a problem in the signal. Do you want me to fix it?" These systems could use chemometric models, give real-time advice, and answer questions during experiments. What once felt like science fiction is slowly becoming part of our everyday work in the lab: the beginning of the intelligent laboratory era.
Finally, as chemometrics continues to grow alongside AI and smart technologies, another key trend is the democratization of tools and knowledge. Open-source software and online educational platforms are making powerful chemometric methods available to more people than ever before. Researchers no longer need to be coding experts or math specialists to apply complex models. Browser-based platforms and interactive tools, often supported by cloud computing and AI assistants, allow users to explore data, build models, and understand results with just a few clicks or questions.
This growing accessibility supports a future where chemometrics is not only more powerful but also more user-friendly, collaborative, and widely used across scientific fields.
Perhaps most importantly, chemometrics embodies a way of thinking about chemical problems that embraces complexity rather than trying to simplify it away. In an era where chemistry increasingly intersects with materials science, environmental science, biotechnology, and other fields, this multivariate perspective becomes ever more valuable.
The story of chemometrics is ultimately about the transformation of chemistry from analyzing one variable at a time to extracting insights from massively multivariate datasets. It shifted the paradigm from reducing complexity to achieve selectivity, to embracing complexity as a source of information. What makes this story particularly compelling is how it illustrates the power of interdisciplinary thinking. The mathematical and statistical methods that form the foundation of chemometrics were developed in other fields for other purposes. But when adapted thoughtfully to chemical problems, with proper attention to the unique characteristics of chemical data and the goals of chemical research, these methods proved transformative.
From the pioneering work of Wold and Kowalski in the early 1970s to today's machine learning integration, chemometrics has consistently evolved to meet the changing needs of chemical science while maintaining its core commitment to extracting meaningful information from complex data. In many ways, chemometrics represents chemistry's coming of age in the information era: the recognition that in a world of abundant data, our ability to extract meaningful insights becomes the limiting factor in scientific progress.